prometheus-mcp-server
The prometheus-mcp-server enables AI to query Prometheus metrics via MCP, enhancing AI-driven infrastructure analysis.
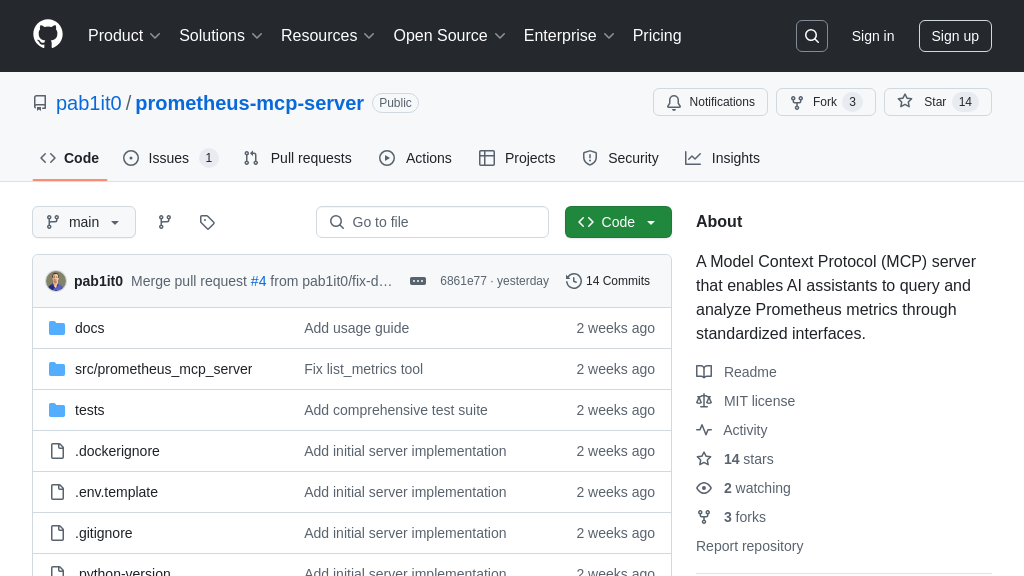
prometheus-mcp-server Solution Overview
prometheus-mcp-server is a Model Context Protocol (MCP) server designed to provide AI assistants with access to Prometheus metrics and queries through standardized MCP interfaces. This server empowers AI models to execute PromQL queries and analyze metrics data, enabling intelligent monitoring and diagnostics.
Key features include the ability to execute PromQL queries, discover and explore available metrics, and retrieve metadata for specific metrics. It supports both instant and range queries with configurable step intervals. The server also offers authentication support via basic auth or bearer tokens from environment variables, and Docker containerization for easy deployment.
By integrating prometheus-mcp-server, developers can enable AI models to proactively identify anomalies, optimize system performance, and automate incident response, leveraging the power of Prometheus data within AI-driven workflows. This solution facilitates seamless interaction between AI and Prometheus, enhancing the capabilities of both.
prometheus-mcp-server Key Capabilities
PromQL Query Execution
The prometheus-mcp-server allows AI models to directly query Prometheus metrics using PromQL, the Prometheus query language. This functionality enables AI to retrieve real-time and historical data about system performance, application health, and other critical metrics. The server translates the AI's request into a PromQL query, executes it against the configured Prometheus instance, and returns the results in a structured format that the AI can understand. This process empowers AI models to make informed decisions based on up-to-date monitoring data.
For example, an AI assistant could use this feature to automatically scale up resources when CPU usage exceeds a certain threshold, or to alert administrators when error rates spike. The AI could execute a PromQL query like sum(rate(http_requests_total{status="500"}[5m])) to monitor the rate of HTTP 500 errors over the past 5 minutes. The server uses the Prometheus API to execute the query.
Dynamic Metric Discovery
This feature enables AI models to dynamically discover and explore available metrics within the Prometheus instance. The prometheus-mcp-server provides tools to list all available metrics, retrieve metadata for specific metrics (including help text and data types), and view instant or range query results. This allows the AI to understand the data landscape and construct meaningful queries without prior knowledge of the specific metrics being exposed. The AI can adapt to changes in the monitored environment and automatically adjust its monitoring strategies.
For instance, an AI could use the list_metrics tool to get a list of all available metrics, then use get_metric_metadata to understand what each metric represents. This is particularly useful in dynamic environments where new metrics are frequently added or existing metrics are renamed. The server uses the /api/v1/metadata endpoint of the Prometheus API to retrieve metric metadata.
Secure Authentication Support
The prometheus-mcp-server supports multiple authentication methods to ensure secure access to Prometheus data. It can be configured to use basic authentication (username/password) or bearer token authentication, both sourced from environment variables. This allows administrators to control which AI models have access to sensitive monitoring data and to enforce security policies. The authentication mechanism protects the Prometheus instance from unauthorized access and ensures data confidentiality.
For example, an organization might use bearer token authentication to grant access to a specific AI model that is responsible for incident response, while denying access to other AI models that do not require access to this data. The server uses the requests library with the appropriate authentication headers to communicate with the Prometheus API.
