mcp-grafana
Grafana MCP Server: Connect AI models to Grafana for real-time data insights and automated incident management.
mcp-grafana Solution Overview
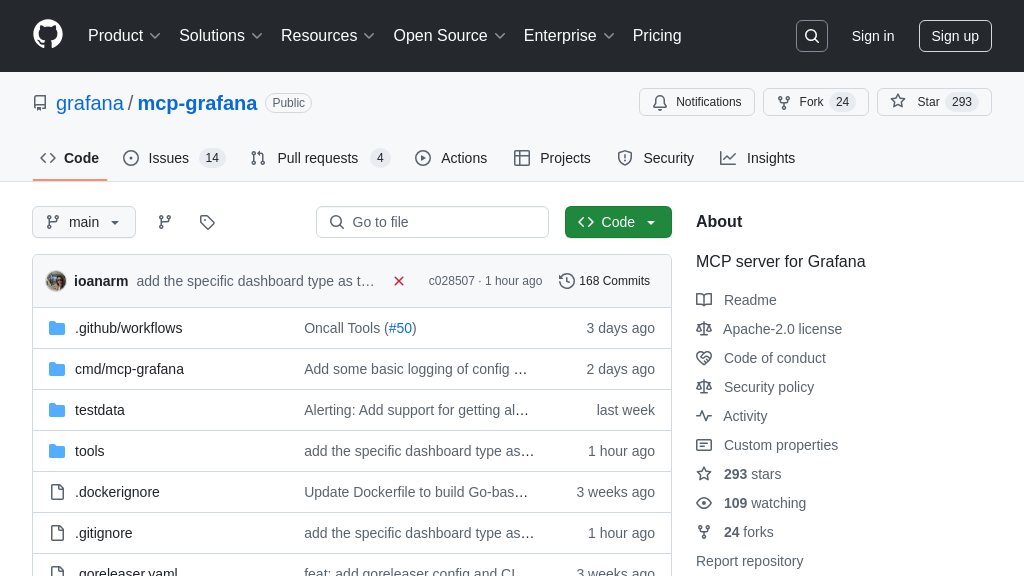
The Grafana MCP Server is a vital tool within the MCP ecosystem, acting as a bridge between AI models and the Grafana data visualization platform. This server empowers AI to directly access and interact with Grafana's rich data and functionalities. It offers a suite of tools for searching dashboards, querying data sources like Prometheus and Loki, managing incidents, and even interacting with Grafana OnCall features.
By providing AI models with direct access to Grafana's insights, developers can build intelligent systems that leverage real-time monitoring data for automated anomaly detection, predictive analysis, and proactive incident management. The server is configured via a simple JSON file, defining the Grafana instance URL and API key. This seamless integration allows AI to leverage Grafana's powerful data visualization and alerting capabilities, enhancing AI-driven observability and response workflows. The Grafana MCP Server unlocks a new level of AI-powered insights from your existing Grafana infrastructure.
mcp-grafana Key Capabilities
Querying Grafana Data Sources
The mcp-grafana server allows AI models to directly query data sources configured within Grafana, such as Prometheus, Loki, Tempo, and Pyroscope. This functionality enables AI models to access real-time metrics, logs, and traces, providing a comprehensive view of system performance and behavior. The server translates natural language requests from the AI model into the appropriate query language (e.g., PromQL for Prometheus, LogQL for Loki) and returns the results in a structured format. This eliminates the need for the AI model to understand the complexities of each data source's query language.
For example, an AI model could ask, "What is the CPU utilization of the web servers in the last 5 minutes?". The mcp-grafana server would translate this into a PromQL query, execute it against the configured Prometheus data source, and return the CPU utilization metrics to the AI model. This allows the AI model to analyze the data and identify potential performance bottlenecks or anomalies. The implementation relies on Grafana's data source plugins and API to execute the queries.
Alert Management
mcp-grafana provides AI models with the ability to interact with Grafana's alerting system. This includes listing alert rules, fetching alert rule information, getting alert rule statuses (firing/normal/error/etc.), creating and changing alert rules, listing contact points, and creating and changing contact points. This allows AI models to proactively manage and respond to system alerts. The AI model can use this functionality to automate incident response, optimize alerting thresholds, and improve overall system reliability.
For instance, an AI model could be used to automatically adjust alert thresholds based on historical data and predicted future behavior. If the AI model predicts a surge in traffic, it could proactively lower the alert threshold for CPU utilization to detect potential issues before they impact users. The implementation leverages Grafana's Alerting API to manage alert rules and contact points.
Incident Management
The mcp-grafana server enables AI models to manage incidents within Grafana Incident. This includes searching for incidents, creating new incidents, adding activity to incidents, and resolving incidents. This allows AI models to automate incident management workflows, improve incident response times, and reduce the impact of incidents on users. By integrating with Grafana Incident, the AI model can leverage the existing incident management infrastructure and collaborate with human operators to resolve issues.
As an example, an AI model could automatically create an incident in Grafana Incident when it detects a critical anomaly in system performance. The AI model could then add relevant information to the incident, such as the affected services, the root cause analysis, and the recommended remediation steps. The implementation uses Grafana's Incident API to create, update, and resolve incidents.
Grafana OnCall Integration
mcp-grafana provides access to Grafana OnCall functionality, allowing AI models to interact with on-call schedules, shift details, and on-call users. This enables AI models to understand the current on-call responsibilities and escalate issues to the appropriate personnel. The AI model can use this functionality to automate on-call rotations, improve incident response coordination, and ensure that critical issues are addressed promptly.
For example, an AI model could use the Grafana OnCall integration to automatically notify the current on-call engineer when a critical alert is triggered. The AI model could also provide the on-call engineer with relevant information about the alert, such as the affected services, the root cause analysis, and the recommended remediation steps. The implementation relies on Grafana OnCall's API to access schedule and user information.
Configurable Tool Selection
The mcp-grafana server allows administrators to configure the list of tools available to the MCP client. This provides flexibility in controlling the functionality exposed to AI models and optimizing the context window size. By selectively enabling tools, administrators can limit the scope of AI model interactions and prevent unintended actions. This feature is particularly useful in environments with strict security requirements or limited resources.
For instance, an administrator might disable the create_incident tool to prevent AI models from automatically creating incidents without human oversight. Alternatively, they might disable less frequently used tools to reduce the size of the context window and improve the performance of the AI model. The configuration is typically managed through a configuration file or environment variables, allowing administrators to easily customize the server's behavior.
